MLB Study hub for opening day is live
07/20/2020
It’s here. It’s finally here! The opening day of MLB and our DFS Study Hub is live for baseball! We have a Study Hub for EVERY SINGLE SPORT so stay tuned!
Okay, Now What?
For baseball, we have RED HOT vs ICE COLD (blue) for statistics. I will describe each section briefly and include a video at the bottom for using the sheet quickly in case you are living the #DadLife or pressed for time.
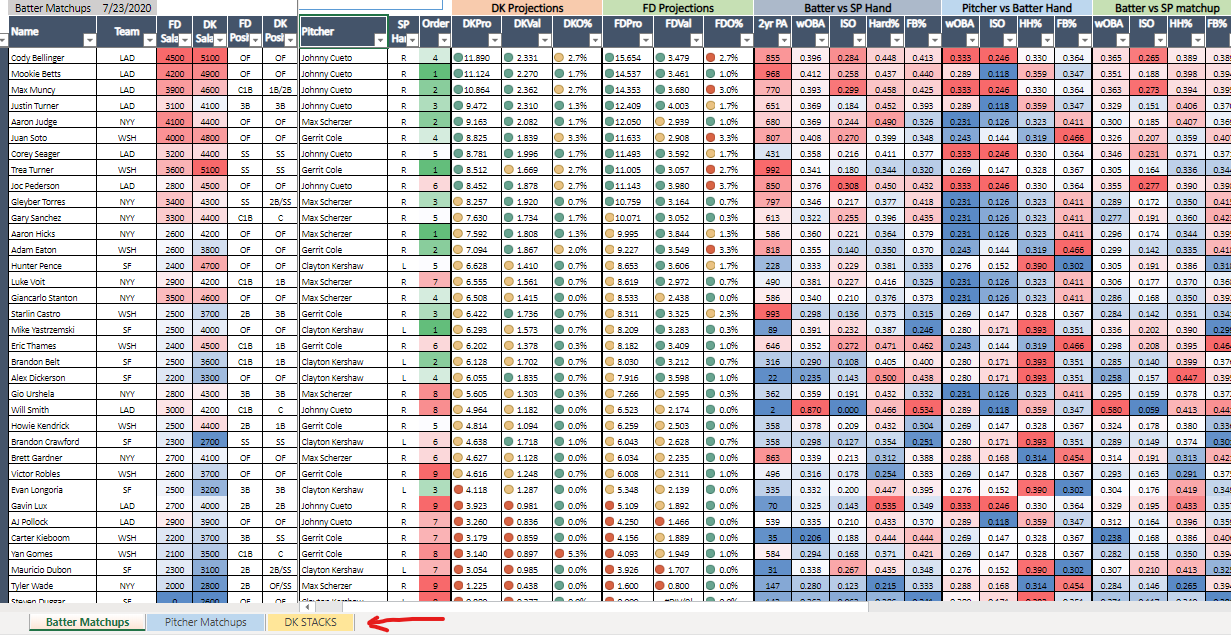
Tab 1 – Batter Matchups
- It reads left to right. Far left has the names, team, their FanDuel and DraftKings salaries, and the position eligibility
- The next block shows the opposing pitcher and the handedness of the pitcher (I.E. Johnny Cueto is a RHP)
- Then we show the projections for each player and break it into Projections | Pts per $ Value | Ownership Projection
- Then we show the batter (i.e. Cody Bellinger) splits against the handedness of the opposing pitcher (Johnny Cueto RHP). That means the stats you see are Bellinger’s stats against RHP
- The category next to it is the pitcher’s splits (Johnny Cueto) against the side of the plate the batter will hit on (Left handed hitter, Cody Bellinger)
- The final block on the far right shows an average of the Pitcher vs Batter splits and the Batter vs Pitcher splits (i.e. a Combined wOBA of Cueto vs. Lefties and Bellinger vs Righties
Tab 2 – Pitcher Matchups
- Again, this reads left to right. First is the names, teams, salaries, then opposing team.
- Next is the DK projections | Pts per $ Value | Ownership Projections and the same for FanDuel
- Next is the Vegas section. This will show his implied chances of winning the game | Team Implied Run Total (IRT) | Opposing team IRT | and the Total Runs for the game
- Lastly, are his personal pitching statistics and these are not splits based
Tab 3 – Stacks
- Far left go ahead and click the PLUS button to drop down a specific team of hitters
- It shows their Salary | Projections | Pts per $ Value
- It then shows their ownership projection (column 1) and then their ownership projection vs the fields’ ownership (column 2)
- The next two columns are simulated projections and range of outcomes based on our models! Video below will help decipher anything you might need help with!